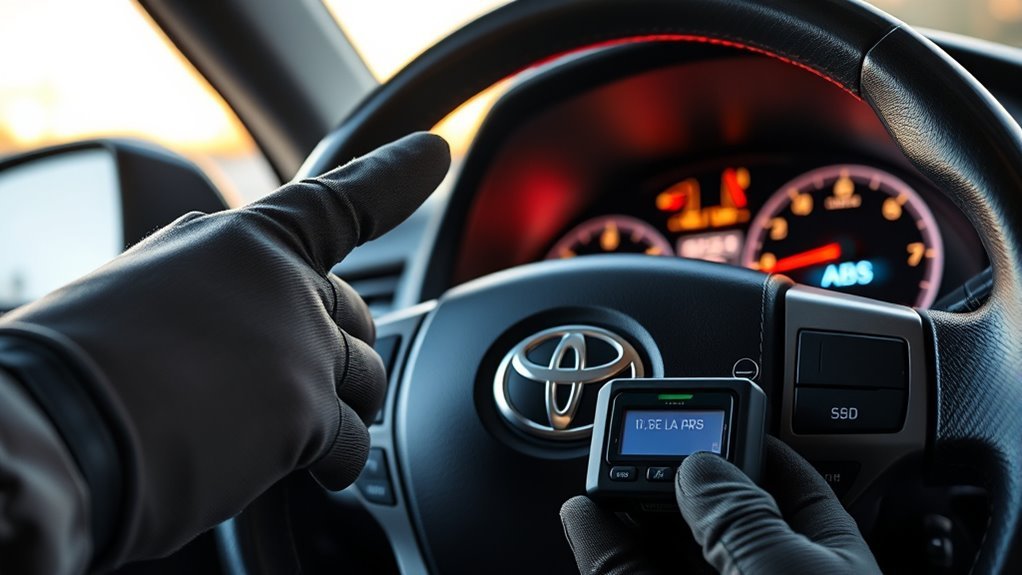
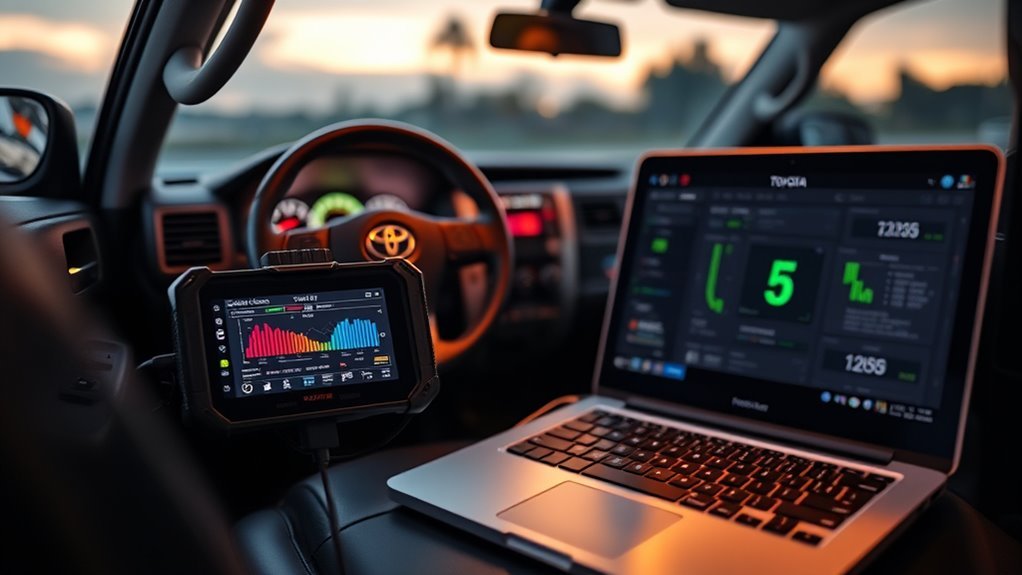
When you pull a 4Runner freeze frame, focus on ECT, IAT, RPM, calculated load, and vehicle speed to define the engine state; compare whether the ECU was in open or closed loop since open loop skews trims. Check STFT/LTFT for >+10% lean or large negative rich trends and watch upstream O2 oscillation versus downstream steadiness. High load or odd temps point to misfires or catalytic stress. Follow-up live data and targeted tests will show precise causes and fixes.
Read Key 4Runner Freeze Frame Parameters (ECT, IAT, RPM, Load, Speed)
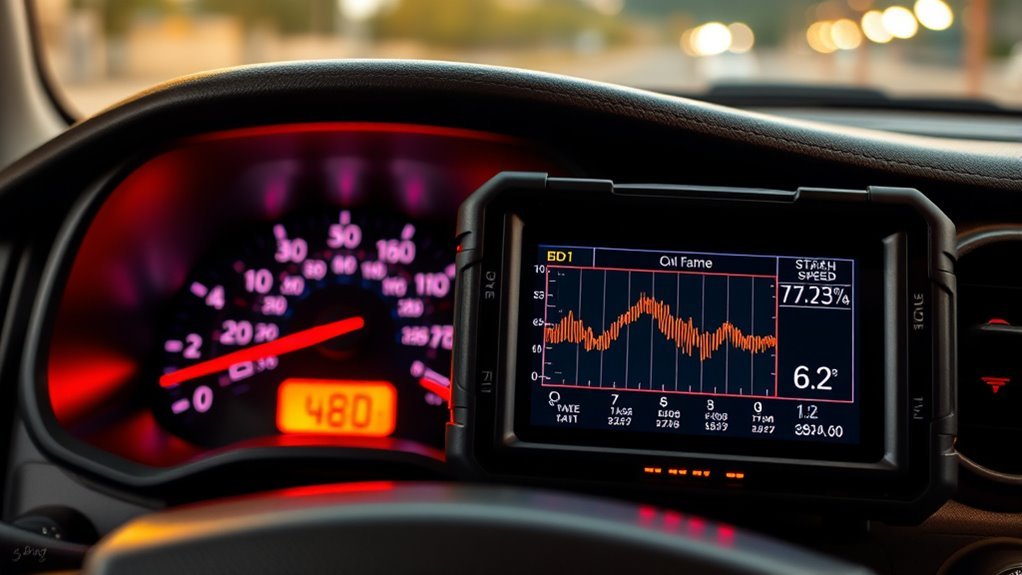
When you read Key 4Runner freeze frame data, start by noting ECT, IAT, RPM, calculated load, and vehicle speed to capture the exact operating state when the fault occurred. You’ll use freeze frame analysis to lock system conditions and guide immediate data interpretation. Check ECT: 180°F–220°F signals normal thermal state; values outside that range change combustion and emissions expectations. Note IAT to assess intake density and its effect on fueling corrections. Record RPM to determine whether the engine was idling, cruising, or under acceleration—each state narrows likely failure modes. Compare calculated load percentage to expected workload; readings approaching or exceeding 100% show stressed conditions that alter symptoms. Finally, log vehicle speed to correlate faults with specific driving scenarios like highway load or low-speed maneuvers. You’ll synthesize these parameters quickly, make targeted tests, and free yourself from guesswork by grounding troubleshooting in objective, actionable data interpretation.
[Products Worth Considering]

The FOXWELL NT301 is a plug-and-play OBD2 code reader designed to help drivers and home mechanics diagnose check engine light issues with ease. It reads fault codes, clears emissions-related warnings, displays live sensor data in graph form, and shows I/M readiness so you can quickly check vehicle status before an emissions test. With broad compatibility across many OBD2 vehicles and a clear color screen, it offers a practical, user-friendly way to monitor and troubleshoot engine performance.

The BLCKTEC 440 Bluetooth OBD2 scanner helps drivers and DIY mechanics quickly read and clear trouble codes, monitor live data, and check emissions readiness with confidence. Its color display, graphing capabilities, and battery and charging system testing make it a versatile diagnostic tool for OBD-compliant vehicles. Designed for plug-and-play convenience, it runs directly from your vehicle and includes support for report sharing and ongoing updates.

FOXWELL NT201 is an easy-to-use OBD2 scanner designed to help drivers quickly read and clear check engine codes, view live engine data, and check emissions readiness. Its color screen, one-key I/M readiness test, and broad compatibility with most gasoline vehicles since 1996 make it a practical tool for everyday diagnostics and maintenance. With plug-and-play operation and lifetime free updates, it offers a simple way to understand vehicle issues without expensive shop visits.
Understand Open Loop vs Closed Loop and Why It Matters
When reading freeze frame data, note whether the ECU was in Open Loop — using default fuel maps during cold start or when sensors like the O2s aren’t ready — because mixture control is less precise. Closed Loop means the ECU is using O2 feedback to trim fuel for ideal combustion and emissions. Identify the shift triggers (coolant/temp thresholds, sensor readiness, and fault conditions) since faults can appear only in one mode and that changes your diagnostic path.
Open Loop Basics
Although the engine runs on pre-programmed settings during warm-up or specific faults, open loop means the control unit ignores real-time oxygen sensor feedback and uses default fueling maps; you’ll see richer or leaner mixtures, higher emissions, and different fuel trim and load figures in freeze frame data until closed loop engages once temperature and sensor conditions are met. You’ll encounter open loop during cold starts or when a sensor fault is present, so freeze frame snapshots often reflect elevated fuel delivery and reduced fuel efficiency. For engine diagnostics, recognize open loop signatures—fixed timing, unadjusted trims, and abnormal load values—before blaming components. Understanding open loop lets you separate expected behavior from true faults, defend efficient operation, and reclaim control over emissions control and system performance.
Closed Loop Operation
Because the ECU switches to closed loop once sensors and coolant reach operating conditions, you’ll see the system use oxygen-sensor feedback to trim fuel in real time for ideal combustion efficiency and reduced emissions. You monitor coolant temperature (typically 180–220°F) and oxygen sensor response to confirm closed loop operation; short-term fuel trim should oscillate within ±10% as the ECU corrects minor deviations. Closed loop advantages include improved fuel economy, lower emissions, and adaptive correction for sensor and load variations. Closed loop limitations are sensor dependency and reduced control when sensors age or fail, which can force persistent open loop and mask true fueling faults. Diagnosing loop state quickly frees you to fix root causes and restore performance.
Transition Triggers
Closed-loop benefits flow from the engine reaching operating temperature, but you also need to know what triggers the switch from open-loop control so you can interpret freeze frame data correctly. You’ll see shifts tied to Engine Coolant Temperature (typically ~160–180°F), O2 sensor readiness, and ECU logic that permits closed-loop fueling. In open loop the ECU follows preset maps; fuel trims won’t show real-time corrections, so freeze frame snapshots during faults can mislead unless you confirm fuel system status. Diagnostic importance is high: an unexpected persistent open loop suggests a bad ECT or O2 sensor, wiring fault, or ECU inhibition. Use freeze frame parameters—ECT, O2 voltage, and fuel system status—to determine whether the fault occurred in OL or CL.
Quick Diagnostic Workflow: Use Freeze Frame, Then Confirm With Live Data
When a fault code appears, grab the OBD2 freeze frame first to lock in critical parameters like coolant temp, RPM, and fuel system status at the exact moment of the event; then use that snapshot to identify the operating conditions that produced the fault (for example high calculated load or abnormal long-term fuel trim). You’ll use freeze frame to chart the specific engine performance state—temperature, speed, load—that triggered the code and to flag anomalies such as excessive calculated load or negative LTFT. With that baseline, attach diagnostic tools and monitor live data: fuel trim, O2 sensor outputs, throttle position, and RPM. Compare live traces to the freeze snapshot; consistent values confirm reproducible faults, while discrepancies point to intermittent or transient failures. Correlate differences to narrow causes: sensor drift, wiring faults, or load-related failures. This workflow frees you from guesswork, giving controlled, evidence-based steps to validate hypotheses and restore reliable operation without ideological or procedural bondage.
Interpret 4Runner Fuel Trim and O2 Sensor Readings for Emissions Faults
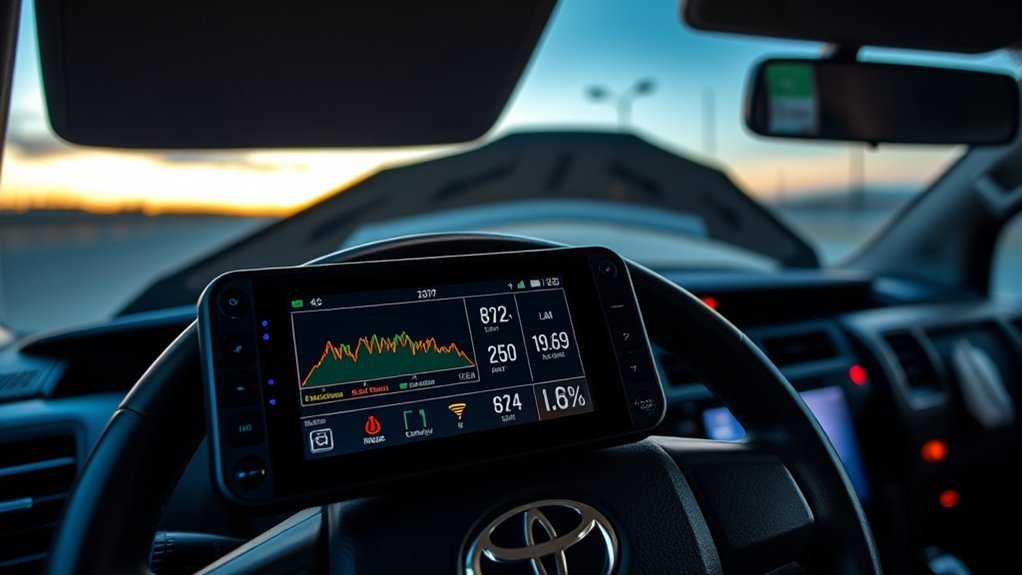
When you check freeze frame and live data, focus on STFT and LTFT values to spot lean or rich trends—STFT should swing within ±10% while LTFT consistently above +10% signals a problem. Watch upstream O2 voltages for rapid 0.1–0.9V oscillation and the downstream sensor for a steady voltage that confirms catalyst efficiency. Correlate those readings with freeze frame parameters (load, coolant temp, fuel status) to pinpoint whether emissions faults stem from sensors, air leaks, or fuel delivery.
Fuel Trim Interpretation
Although fuel trim numbers can seem cryptic, you should treat STFT and LTFT as the ECU’s real-time and learned corrections to maintain the target air–fuel ratio. You’ll view STFT > +10% as an active lean indication that demands investigating intake leaks, fuel delivery, or fuel injector issues. When LTFT stays positive across both banks, the ECU is compensating for a persistent lean state—suspect faulty injectors or a misreading mass airflow sensor. Consistently negative LTFT implies a rich condition; check fuel pressure regulator and leaking injectors. Compare upstream O2 behavior to downstream patterns to isolate catalytic converter performance, but don’t assume sensor failure until you’ve ruled out intake, fuel, and MAF-related causes. Act decisively to reduce emissions.
O2 Sensor Behavior
If you’re diagnosing emissions on a 4Runner, start by reading both upstream and downstream O2 sensors alongside STFT and LTFT to see how the ECU is compensating for air–fuel variations. You’ll watch upstream oscillation for active control and downstream stability for catalytic monitoring. LTFT/STFT outside ±10% signals lean/rich issues; persistent >+10% means lean. Steady O2 voltages imply sensor or converter failure. After 100k miles, verify O2 sensor calibration and swap questionable sensors to restore emissions efficiency. In P0420 cases, negative LTFT points at rich conditions—check for exhaust leaks and sensor drift. You want freedom from emissions faults: test, replace, and reset trims to reclaim clean, efficient operation.
| Sensor | Role | Emotion |
|---|---|---|
| Upstream | Active control | Vigilant |
| Downstream | Converter check | Confident |
| LTFT/STFT | Compensation | Liberated |
How Freeze Frame Data Helps Common 4Runner Codes (P0300, P0420, P0171/P0174)
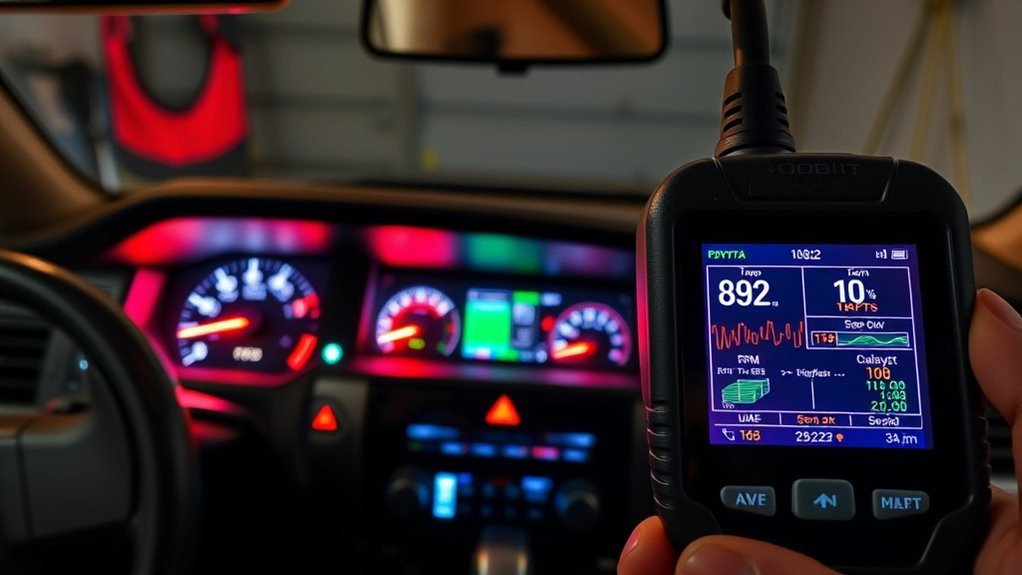
Because freeze frame captures the exact engine state at the moment a fault is logged, it gives you concrete data—coolant temp, intake air temp, engine load, short‑ and long‑term fuel trims, and O2 sensor status—that directly narrows causes for codes like P0300, P0420, and P0171/P0174; for example, high positive fuel trims point to lean conditions or vacuum leaks for P0171/P0174, erratic load/temperature readings correlate with random misfires for P0300, and closed‑loop operation with abnormal trim/O2 readings helps confirm catalyst inefficiency for P0420. Use freeze frame for targeted engine diagnostics and performance analysis: compare trims and intake conditions to expected ranges, flagging fuel delivery or vacuum issues. For misfire troubleshooting, correlate misfire counts with load and temperature to isolate intermittent versus systemic faults. For emissions monitoring, verify closed‑loop status and O2 response at fault time to distinguish sensor, fuel, or catalyst failures. Cross‑reference service history to reveal recurring patterns and prioritize corrective actions that restore freedom from repeat failures.
[Products Worth Considering]

The TOPDON VeriDiag X800 BT is a wireless bidirectional automotive diagnostic scanner designed for full-system troubleshooting, active testing, and advanced service resets. It supports broad vehicle coverage, live data viewing, AutoVIN identification, and lifetime free updates to help DIYers and professionals diagnose issues faster and with greater confidence.

This plug-and-play OBD2 scanner helps drivers quickly read and clear engine error codes while providing live data, freeze frame information, I/M readiness, and MIL status for more confident troubleshooting. It adds a built-in voltage test and clear status indicators to support electrical checks and faster diagnostics, making it a practical choice for home users, car enthusiasts, and repair professionals. Compatible with most OBDII vehicles since 1996 and designed with an easy-to-use interface, it offers broad coverage and simple operation in one compact tool.

The ZMOON ZM201 is a plug-and-play OBD2 code reader designed to quickly diagnose check engine issues on compatible vehicles after 1996. It reads and clears engine fault codes, displays live data and freeze frame information, checks I/M readiness, and helps you identify problems before visiting a repair shop. With a color screen, intuitive controls, and built-in DTC database, it offers an easy-to-use solution for DIY drivers and car owners who want reliable engine diagnostics.
Step‑By‑Step Troubleshooting With Freeze Frame + Live Data (Tests & Swaps)
Now that you know how freeze frame narrows probable causes for codes like P0300, P0420, and P0171/P0174, use a combined freeze‑frame plus live‑data workflow to verify and isolate faults. Start by reviewing ECT (180–220°F target) and LTFT (>+10% signals lean) in the freeze frame for precise fault code interpretation and engine performance assessment. Then monitor RPM, TP, and fuel trims live while recreating conditions.
| Step | Action | Expected check |
|---|---|---|
| 1 | Inspect freeze frame ECT/LTFT | ECT 180–220°F, LTFT baseline |
| 2 | Record live RPM/TP during event | Stable vs intermittent differences |
| 3 | Swap suspect coil/injector | Shifted misfire or trim response |
| 4 | Re-scan freeze + live data | Confirm resolved or persistent fault |
Use component swaps (coils/injectors) only to isolate changes in live traces and subsequent freeze frames. Document before/after data; liberation comes from evidence-driven repairs.
When to Bring It to a Shop: Compression, Fuel Pressure, Catalytic Tests
When freeze‑frame data points to systemic issues—like uniformly low compression, a marked drop in fuel pressure, or O2 traces that imply catalytic inefficiency—you should take the vehicle to a shop for definitive diagnostic tests (compression leak‑down, fuel pressure under load, and catalytic converter efficiency). You want clear answers: low readings across cylinders often indicate worn rings or a blown head gasket, and significant fuel pressure loss signals pump or filter failure. Negative long‑term fuel trim trends suggest vacuum leaks or injector faults. Abnormal O2 behavior raises catalytic efficiency concerns. Elevated engine temperature compounds risk and demands immediate attention.
If freeze‑frame shows systemic faults—low compression, fuel pressure loss, or strange O2 traces—get shop diagnostics immediately.
- Compression issues — shop performs cylinder compression and leak‑down to quantify loss and locate failures.
- Fuel diagnostics — technician measures static and under‑load fuel pressure, inspects pump, filter, and injectors.
- Catalytic efficiency — exhaust/backpressure and sensor tests confirm converter function and prevent emissions failures.
Frequently Asked Questions
What Does Freeze Frame Do on an OBD2 Scanner?
Freeze frame captures a snapshot of engine conditions when a fault occurs; you’ll use that data logging to analyze parameters like RPM, coolant temperature, and vehicle speed, letting you pinpoint intermittent issues and free your diagnostics.
What Type of DTC Has the Highest Freeze Frame Priority?
High-emission DTCs like P0420 have the highest freeze frame priority. You’ll use the DTC hierarchy to focus diagnostics; freeze frame importance is that it captures detailed conditions so you can quickly address critical, emissions-related faults.
How to Interpret OBD2 Codes?
About 70% of drivers misread codes; you’ll learn OBD2 basics fast: read DTCs with diagnostic tools, note freeze frame and fuel trims, map P/B/C/U types, prioritize high-severity DTCs, then test and resolve systematically.
Conclusion
You’ll use freeze frame like a snapshot: note ECT, IAT, RPM, load, speed, loop status and trims to pinpoint conditions when the fault occurred. Compare to live data, run focused tests (misfire checks, O2 response, fuel pressure, compression) and swap sensors only when data points there. If readings suggest mechanical or catalytic failure—or you hit conflicting results—bring it to a shop. Don’t try time travel; act on hard numbers now.
[Products Worth Considering]
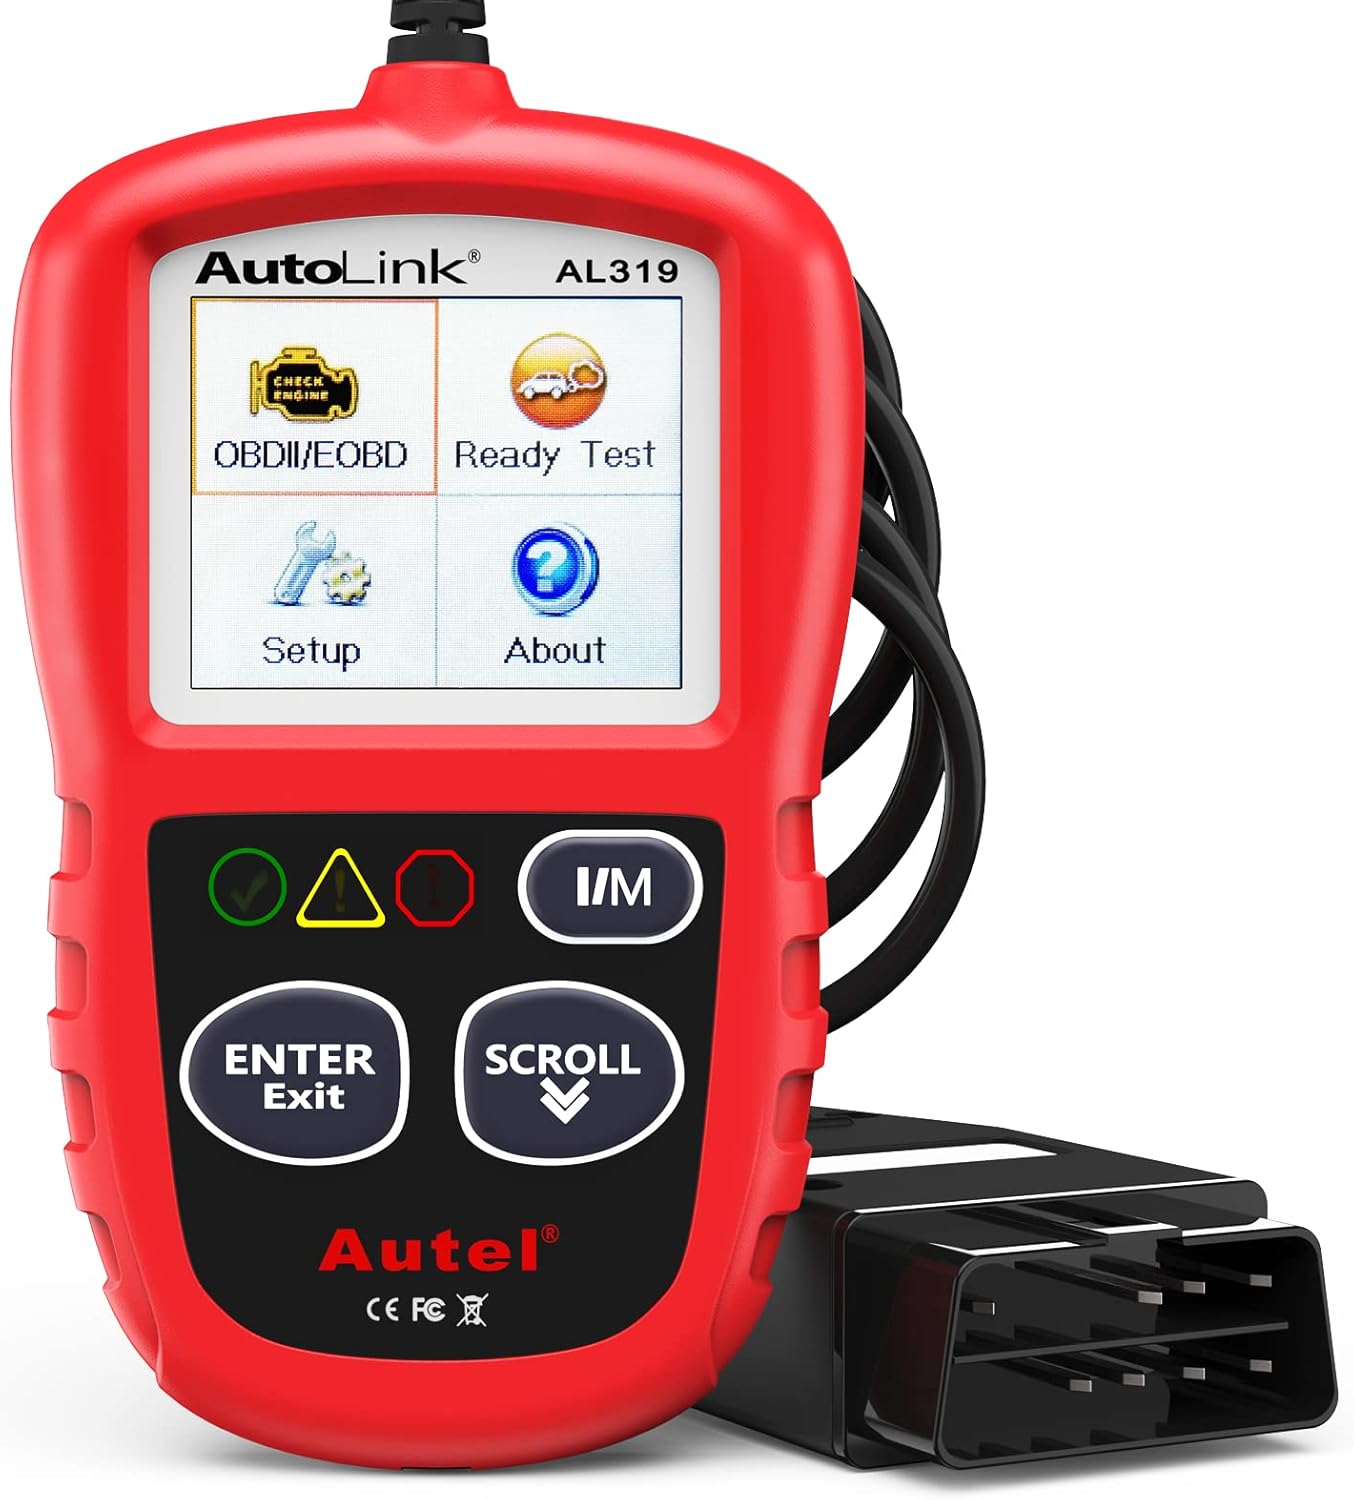
The Autel AL319 is a user-friendly OBD2 scan tool designed to help drivers quickly diagnose check engine light issues and understand vehicle fault codes. It supports reading and clearing DTCs, live data, freeze frame, I/M readiness, and vehicle information, making it a practical choice for DIYers and everyday car owners. With plug-and-play operation, a color display, built-in speaker, and broad vehicle compatibility, it delivers fast, reliable diagnostics without complicated setup.

This oxygen O2 sensor set is designed for select Toyota Camry and RAV4 models with 2.4L engines, providing upstream and downstream replacement coverage in one package. Built to OEM specifications for plug-and-play installation, it helps improve fuel efficiency, support accurate air-fuel monitoring, and restore reliable engine performance. The stainless steel and heat-resistant construction is made for long-lasting durability and stable operation.
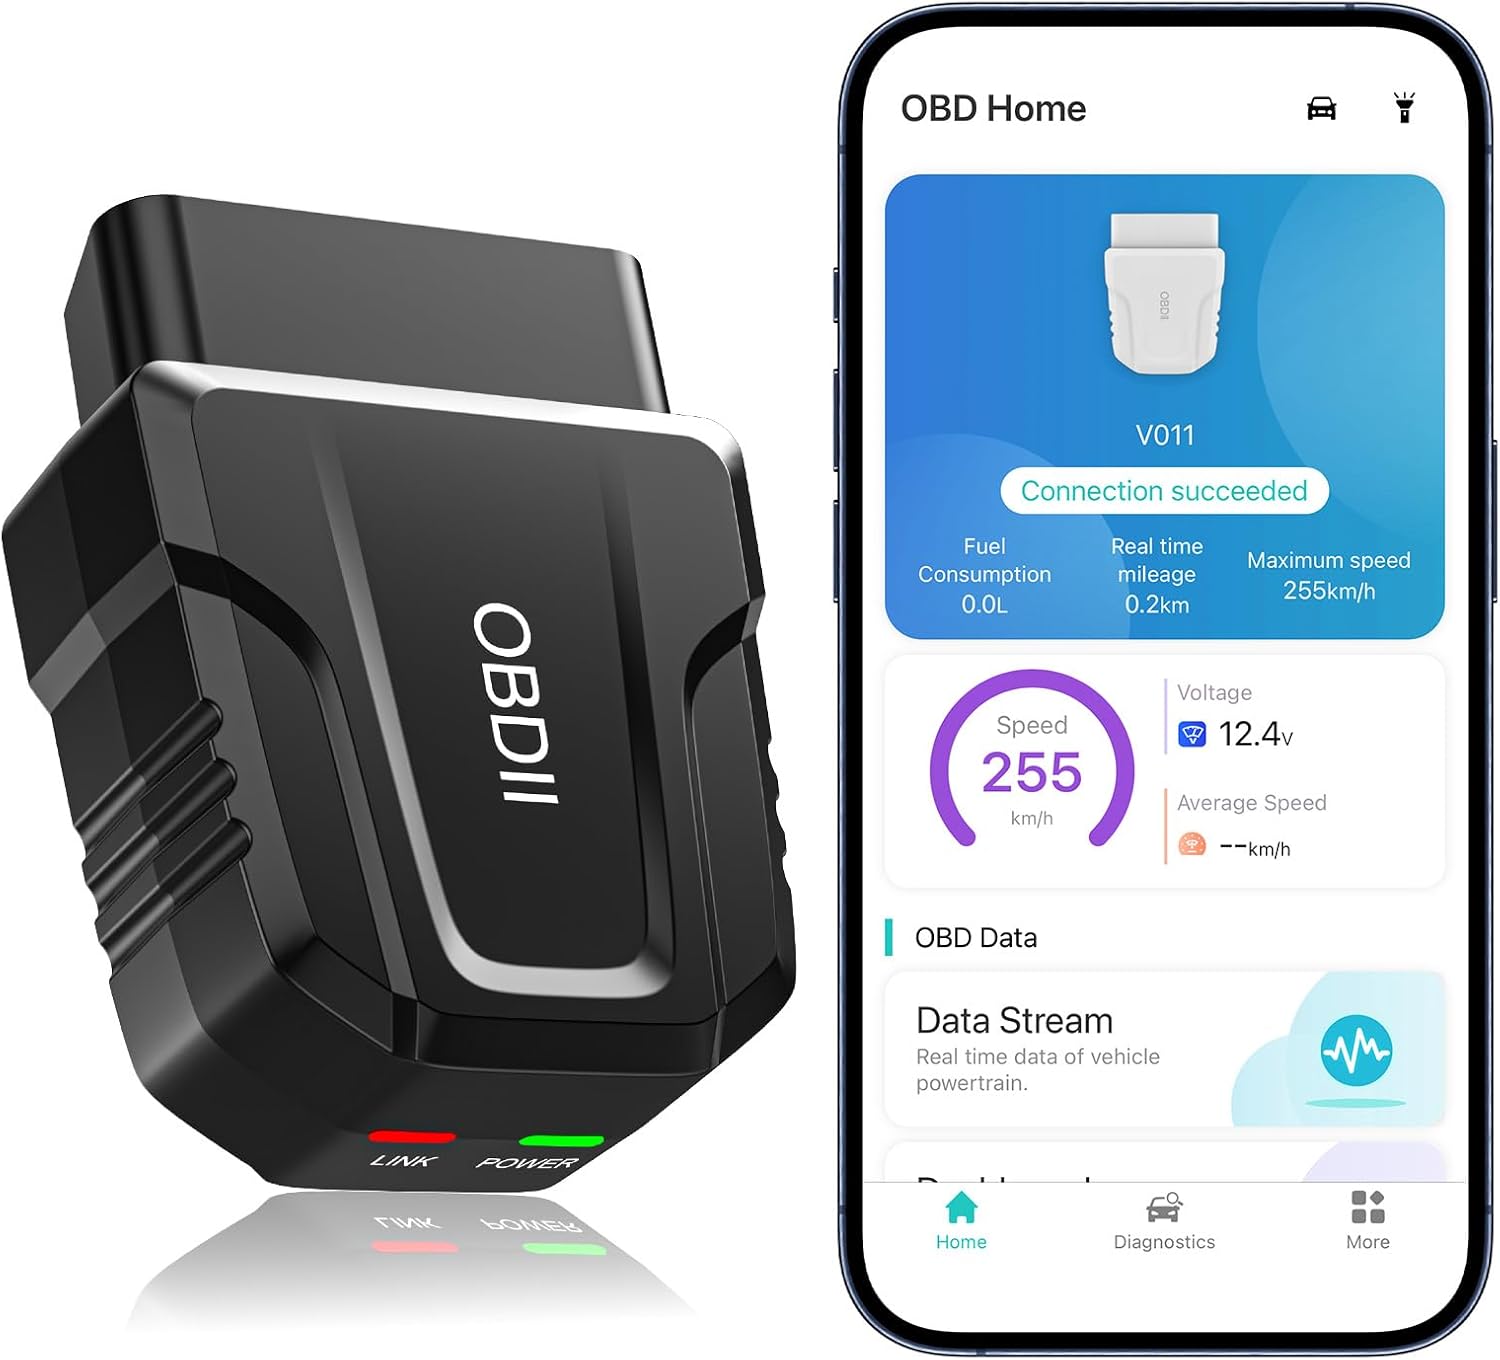
The UMEIJA V011 OBD2 scanner delivers comprehensive vehicle diagnostics with Bluetooth connectivity and a dedicated app for iOS and Android. It supports live data, fault code reading and clearing, readiness checks, freeze frame, sensor data, and performance testing to help drivers understand and monitor vehicle health. With broad compatibility across many car and truck models and easy-to-read data visualization, it is a practical tool for both beginners and experienced users.